GIS Cloud Suite
Geoprocessing Service Monitoring And Management
The GIS Cloud Suite can monitor and manage the environment for geoprocessing services, making it easy for users to grasp the health status of the service.
Geoprocessing Service Management
Service Management
On the page Geoprocessing Service, users can manage services by using the following functions, as shown in the following figure:
- Geoprocessing Service Status: To check if the service is running, clicks on Enable/Disable to open/close the service.
- Name: The name of the service, clicks on the name to enter container page. For details, please refer to Container Management.
- Address: Provides the link of geoprocessing service, clicks the link to enter geoprocessing service interface.
- Description: Describes the function of the service.
- Status: Shows the number of running/total replicas in the service.
- Adjust Spec: Adjusts the service’s CPU and Memory spec.
- Redeploy: Redeploys the service.
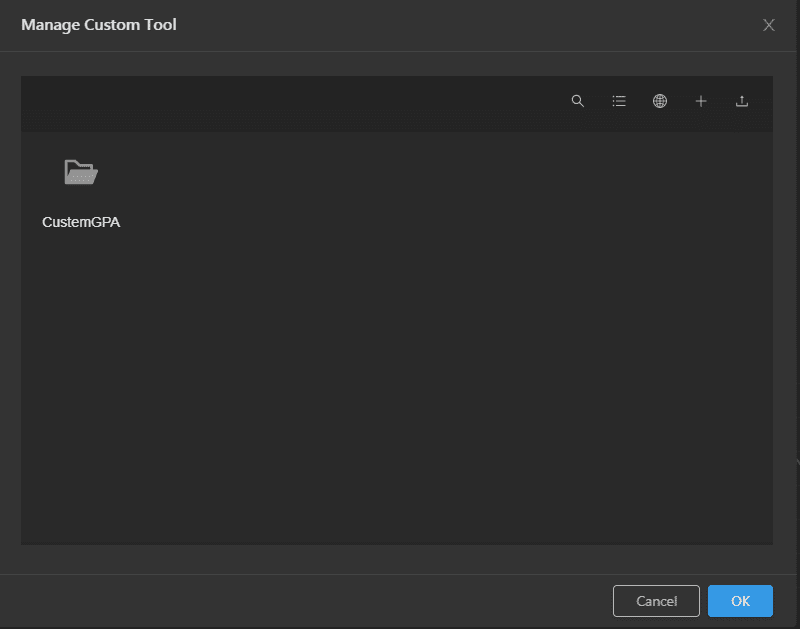
- Custom Tools: Display the added custom toolkits (*. jar), supporting uploading, downloading, renaming, moving, copying, modifying permissions, and deleting custom tools. When using the iserver-geoprocessing service customization tools to build a model, it is necessary to upload the customization tool file first. It should be noted that please upload the custom tool file in ”. jar” format to the root directory for use. If uploaded to a subdirectory, it will not take effect.
Container Management
Clicks on the name of Geoprocessing Service to enter the container page, the page lists the information of container name, IP, status, duration, and host machine. If the container malfunctioned, you can recreate the container, the service would stop working until finishing recreating.
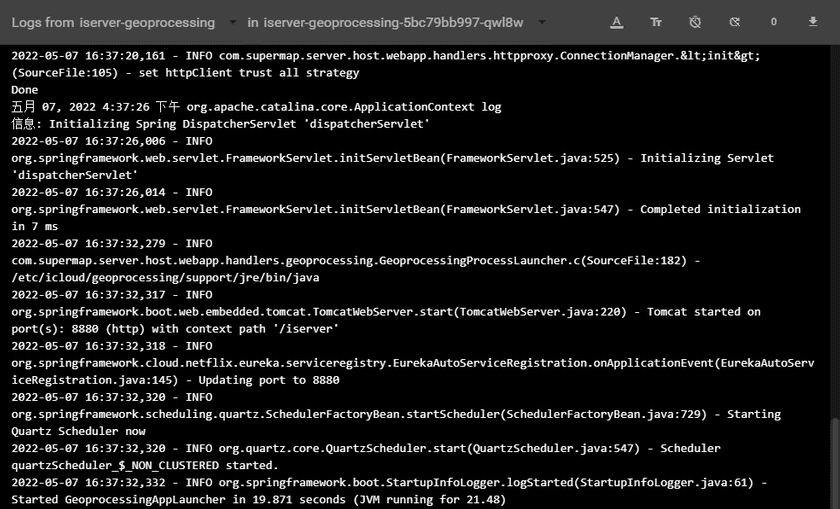
Clicks on Logs to see the container’s log, the log has the running record of the container from creation to the present.
Clicks on Command pad to enter the container’s command interface, where you can directly operate the container.
Geoprocessing Service Monitoring
Enter the Geoprocessing Service and roll to the monitoring panels.
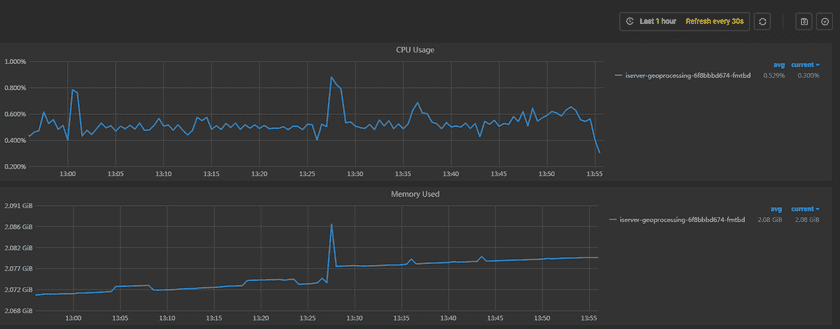
The monitoring panels record the real-time indicators of CPU useage, memory useage, network in/out, and filesystem useage of the services. The monitoring panels could be enlarged or narrowed, and draged to other places of the page. More functions are listed below:
- Select recording range: Choose the time range of the monitor recording.
- Set refresh time: Set the refresh interval of the panels.
- Refresh: Click the button to refresh the panels.
- Save dashboard: After changing the panels’ size or draging the panels, click the button to save the current layout.
- Versions: All the layout styles are saved in the Versions, the Versions has the ability of restoring the layout to any style.
Note:
The buttons for the above functions are located in the orange box in the upper right corner of the following figure.


