GIS Cloud Suite
Service Nodes Monitoring
GIS Cloud Suite provides service nodes monitoring function, users can know the loads of services/containers from the monitoring panels, it is helpful to analysis the health of the nodes.
The content below is going to introduce the service monitoring and container monitoring separately.
Nodes Monitoring
Clicks on Service Management > Service Nodes on the left side navigation bar and roll to the monitoring panels.
The monitoring panels record the real-time indicators of CPU useage, memory useage, network in/out, and filesystem useage of the services. Clicks on the service name in the legend to check the specific service recording. The monitoring panels could be enlarged or narrowed, and draged to other places of the page. More functions are listed below:
- Select recording range: Choose the time range of the monitor recording.
- Set refresh time: Set the refresh interval of the panels.
- Refresh: Click the button to refresh the panels.
- Save dashboard: After changing the panels’ size or draging the panels, click the button to save the current layout.
- Versions: All the layout styles are saved in the Versions, the Versions has the ability of restoring the layout to any style.
Container Monitoring
On the service node page, clicks on the name of service node to enter the container page. The monitoring panels record the real-time indicators of CPU useage, memory useage, network in/out, and filesystem useage for the containers. The monitoring panels could be enlarged or narrowed, and draged to other places of the page. Users could also save layout, manage versions, set custom time range, set refresh time, and refresh the panel manually.
JVM Monitor of Container
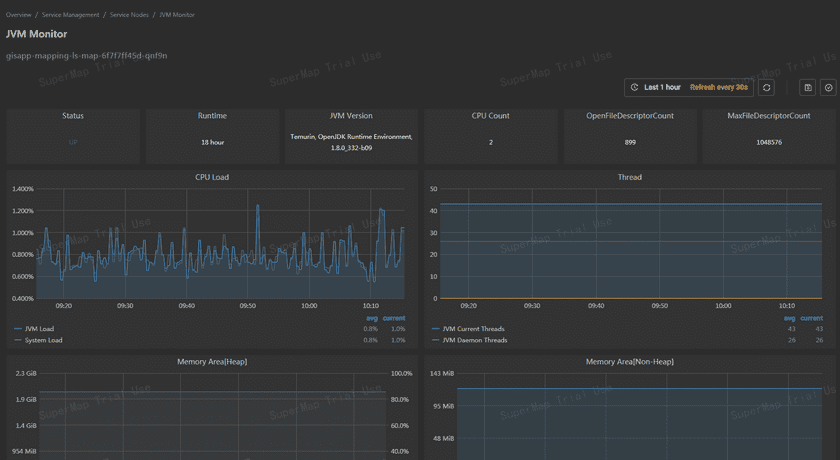
On the Node Details page, click the JVM button corresponding to the container to enter the JVM Monitor page. This page provides various JVM indicator monitoring functions for individual containers, used to monitor important JVM indicators, including basic information such as JVM Status, Version, Runtime, CPU Counts and Memory Area(Heap and Non-Heap) indicators, Direct Buffer indicators, Mapped Buffer indicators, GC (Garbage Collection) Count Increase and JVM Threads and other related indicators.
