Tutorial
Basic Services
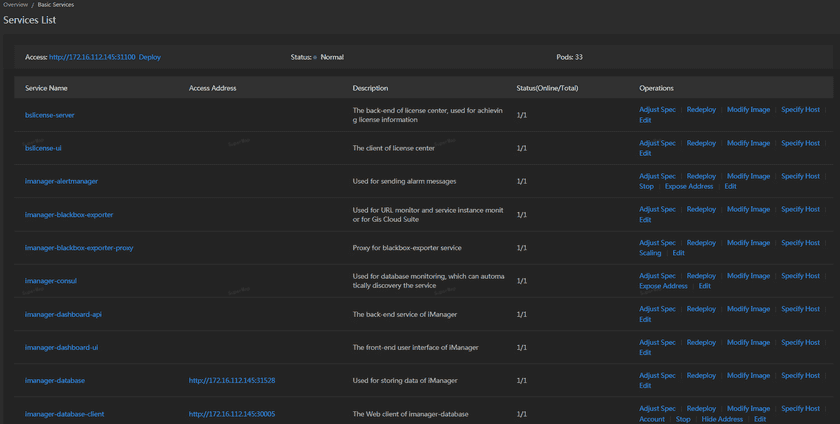
SuperMap iManager combines with Microservices, Docker, and Kubernetes technology. The functions of traditional iManager were splitted into various of independent services, as the screenshot shows. Administrator can monitor the services, redeploy the services, adjust the specs of service, stop/start the services, modify the images of service, transfer the services to specified host, expose/hide the service addresses, view the log of services, and scaling the service nodes.
The basic services include:
- Alertmanager: Used for sending alarm messages.
- Blackbox-exporter: Used for URL monitoring.
- Bslicense-Server:The back-end of the license center, used for achieving license.
- Bslicense-UI:The client of license center.
- Consul-Server: Used for database monitoring, which can automatically discovery the service.
- Elasticsearch:Used for storing logs and visiting records.
- Grafana:The analysis and monitoring platform, used for displaying load information of machines and services.
- Grafana-database: PostgreSQL database, used for storing the data of Grafana.
- iManager-dashboard-API:The back-end service of iManager.
- iManager-dashboard-UI:The front-end user interface of iManager.
- iManager-gateway: The gateway of iManager, all the requests should go through the gateway.
- iManager-MySQL:MySQL database, used for storing the data of iManager.
- iManager-NFS-client-provisioner:Used for dynamic storing of network file system.
- iManager-PhpMyAdmin:The management tool of MySQL database, manages MySQL database which storing iManager information by Web client.
- iManager-Weixin-hook: The proxy address of WeChat Work, used for WeChat Work alarm.
- K8s-dashboard:The user interface of Kubernetes.
- Keycloak:The open source solution for the authorition and visit management between application and service, it is used for managing accounts to get the purpose of safety and unified.
- Keycloak-PostgreSQL: PostgreSQL database, used for storing the data of Keycloak.
- Kibana:Displays logs and visiting statistics, visualized data in Elasticsearch.
- Kube-state-Metrics:Metrics library for monitoring indicators, used for monitoring the status of containers.
- NFS-client-provisioner-1:Used for dynamic storing network file system.
- Nginx-ingress-controller: The ingress monitoring.
- Prometheus:The monitoring system, used for monitoring the resource load.
