Tutorial
GIS Cloud Suite Monitoring
SuperMap iManager supports to monitor GIS Cloud Suite environment. Users can understand the associations between the services and the status of services through topological diagram; grasp the overall status of the environment by monitoring the services; achieve service trace and service metrics by monitoring services flow.
The content below is going to introduce topological diagram monitoring, resources monitoring, and flow monitoring separately.
Topological Diagram
Please follow the steps to view the topological diagram:
- Clicks Sites Management > Your GIS Cloud Suite Site on the left navigation bar to enter the page.
-
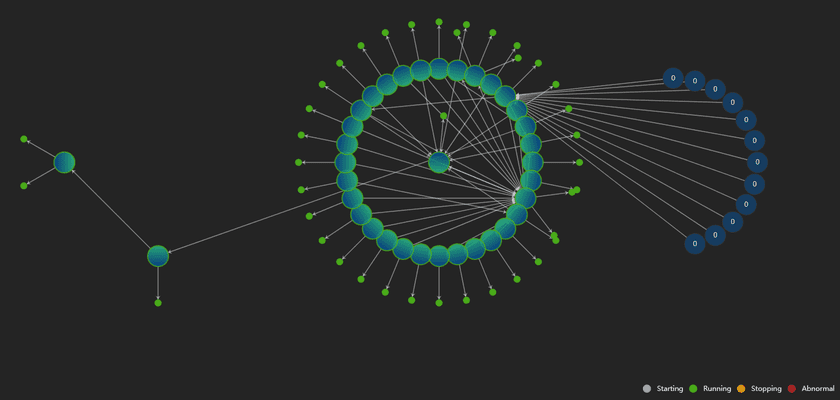
Clicks on Topo Diagram on the upper left side of the page. As the screenshot below, view the topological diagram of the GIS Cloud Suite environment.
The topological diagram of GIS Cloud Suite is helpful for understanding the associations between the services. In the diagram, exclusive and diamond icons represent the services; circle symbols represent service nodes(if the service extended, you can see a service has multiple circle nodes), the green circle means the service is running good, the red circle means the service is not working. The topological diagram supports to zoom in/out, if you put the mouse on the service, the associated services will be highlighted, the associations between the services will be explained by the arrows and texts.
Resources Monitoring
SuperMap iManager builds in visualization and analytics software Grafana,supports to monitor the resources usage of services and containers, and check the real-time loads.
Service Resources Monitoring
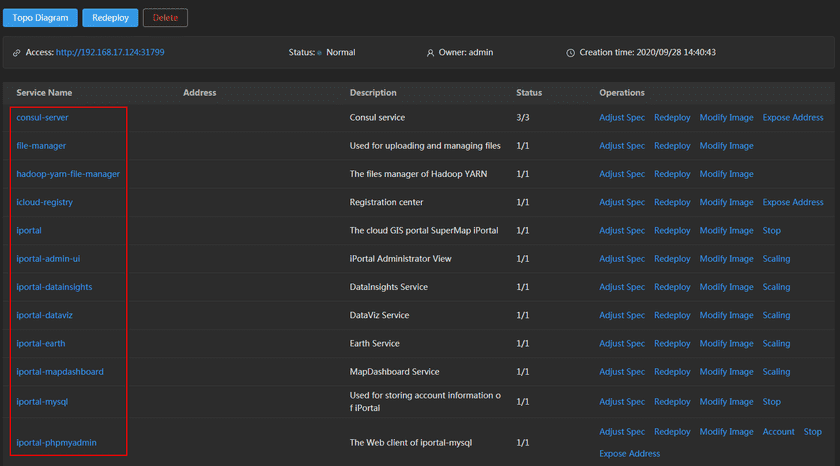
On the home page of the GIS Cloud Suite environment, rolls to the monitoring panels on the bottom of the page.
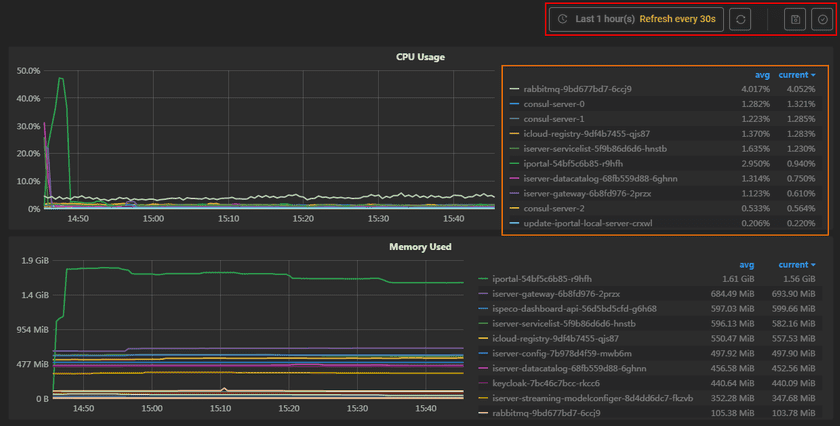
The screenshot below is the statistic chart of GIS Cloud Suite environment. The monitoring panels record the real-time indicators of CPU useage, memory useage, network in/out, and filesystem useage of the services. The monitoring panels could be enlarged or narrowed, and draged to other places of the page. Click the services on the legend can switch the monitor objects. More functions are listed below:
- Select recording range: Select the time range of the monitor recording.
- Set refresh time: Set the refresh interval of the panels.
- Refresh: Click the button to refresh the panels.
- Save dashboard: After changing the panels’ size or draging the panels, click the button to save the current layout.
- Versions: All the layout styles are saved in the Versions, the Versions has the ability of restoring the layout to any style.
Container Resources Monitoring
On the home page of the GIS Cloud Suite environment, clicks on the name of the service to enter the container monitoring page.
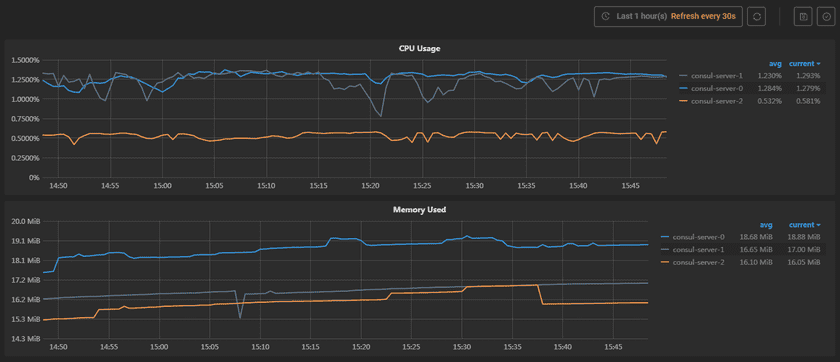
View the statistic chart of the containers on the bottom.
The screenshot below shows the running status of the containers. The monitoring panels record the real-time indicators of CPU useage, memory useage, network in/out, and filesystem useage of the containers. The monitoring panels could be enlarged or narrowed, and draged to other places of the page. What is more, users can save dashboard, control versions, select recording range, set refresh time,and manual refresh the panels, please refer to Service Resources Monitoring for the details.
Flow Monitoring
SuperMap iManager uses Istio platform to integrate microservices, manage traffic flow across microservices, enforce policies and aggregate telemetry data.
Istio is available to formulate the access strategy of services, to achieve access control. Access control ensure a service can only be accessed by authorized services, unauthorized services can not access, it improves the security of the system.
Service Trace
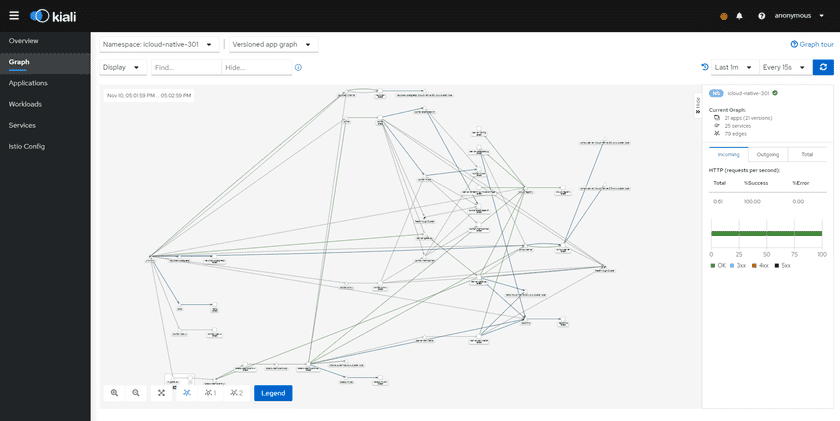
On the home page of GIS Cloud Suite, clicks on Service Trace on the top left side to enter kiali page. kiali has six observability features, they are Overview, Graph, Applications, Workloads, Services, and Istio Config. It combines topology, telemetry, traces, logs, events and definitions in a holistic view of your system.
Graph feature visualizes the flow status of applications, services, and workloads in GIS Cloud Suite, provides real-time topological diagrams. As the screenshot below, on the top left of the page, you can select the monitoring sites(called namespace in Kubernetes as well), select the main object(app, service, versioned app, or workload), set the display in the topological diagram, find/hide the edges and nodes. On the bottom left of the page, you can zoom in/out the topological diagram, select the layout, open/close the legend. On the right side of the page, you can set the lookback time, set the automatic refresh time, check the number of monitoring objects(app, service, edges, etc.), and check the incoming/outgoing of flow. More introduction please refer to kiali Documentation.
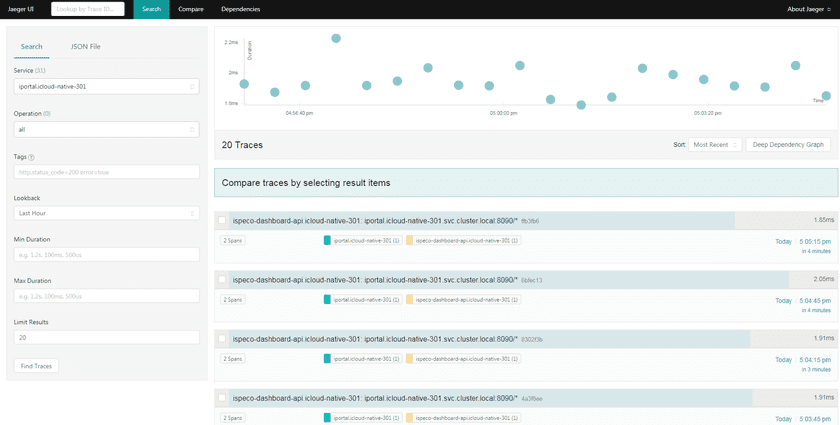
On the home page of GIS Cloud Suite, clicks on Service Trace in the service list to enter Jaeger UI. Jaeger UI is available to view the traces and spans of the service. A trace is the complete processing of a request. The trace represents the whole journey of a request as it moves through all of the services of a distributed system. Span in the trace represents one microservice in the execution path.
As the screenshot below, you can filter the service trace by the options on the left side of the page:
- Service: Select the object service.
- Operation: Select the operation in the service trace.
- Tags: Filter the service trace by status code, request result, and so on.
- Lookback: Select the time range.
- Min Duration: Set the minimum duration of service trace.
- Max Duration: Set the maximum duration of service trace.
- Limit Resultes: Set the number of traces to display.
The right side of the page shows the result traces. The x-axis of the chart is the time point when the traces happened, the y-axis is the duration of the traces. You can select how to sort the traces, click on “Deep Dependency Graph” to check the dependency of the services. In the list of result items, you can see the number of spans, duration, and occurrence time, click on each item to see the trace details. More introduction please refer to Jaeger Documentation.
Service Metrics
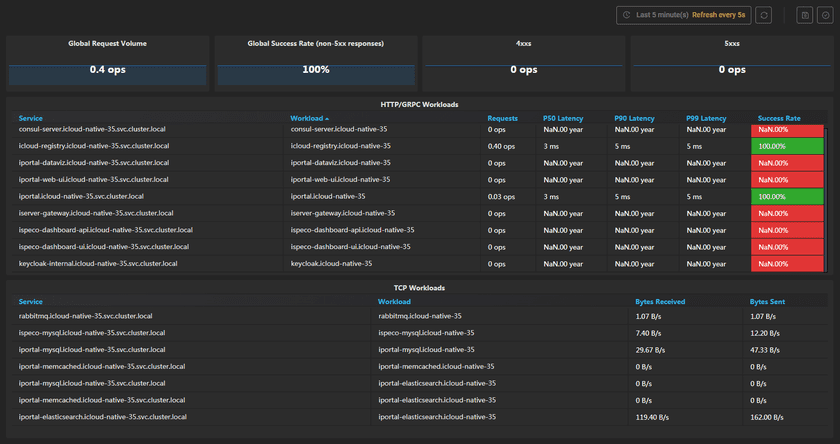
On the home page of GIS Cloud Suite, clicks on Service Metrics on the top left side to check the metrics of the environment. The page shows the metrics of Global Request Volume, Global Success Rate(non-5xx responses), 4xxs, 5xxs, HTTP/GRPC Workloads, and TCP Workloads.
- Global Request Volume: The number of requests per second.
- Global Success Rate(non-5xx responses): The success rate of requests, all the non-5xx responses regard as succeed. 5xx response means the error from the server.
- 4xxs: The number of 4xx responses per second. 4xx response means the error from the client.
- 5xxs: The number of 5xx responses per second.
The table of HTTP/GRPC Workloads has listed the metrics of Service, Workload, Requests, P50 Latency, P90 Latency, P99 Latency, and Success Rate.
- Service: The monitoring objects, the objects are named by kube-dns. The format is “ServiceName.Namespace.svc.cluster.local”.
- Workload: The format of the objects in the workload is “ServiceName.Namespace”.
- Requests: The number of requests per second of the service.
- P50 Latency: The P50 value of the response latency. For example, if the P50 Latency is 3 ms, it means there are 50 percentage that the response latency is less than 3 ms.
- P90 Latency: The P90 value of the response latency. For example, if the P90 Latency is 5 ms, it means there are 90 percentage that the response latency is less than 5 ms.
- P99 Latency: The P99 value of the response latency. For example, if the P99 Latency is 5 ms, it means there are 99 percentage that the response latency is less than 5 ms.
- Success Rate: The success rate of service requests.
The table of TCP Workloads has listed the metrics of Service, Workload, Bytes Received, and Bytes Sent.
- Service: The monitoring objects, the objects are named by kube-dns. The format is “ServiceName.Namespace.svc.cluster.local”.
- Workload: The format of the objects in the workload is “ServiceName.Namespace”.
- Bytes Received: The speed of bytes received.
- Bytes Sent: The speed of bytes sent.
The monitoring panels could be enlarged or narrowed, and draged to other places of the page. What is more, users can save dashboard, control versions, select recording range, set refresh time, and manual refresh the panels, please refer to Service Resources Monitoring for the details.
On the home page of GIS Cloud Suite, clicks on Service Metrics in the service list to check the metrics of single service. The page shows the metrics of aimed SERVICE, CLIENT WORKLOADS, and SERVICE WORKLOADS. CLIENT represents the services that are calling aimed service; SERVER represents the services that are providing aimed service.
The aimed SERVICE has the following metrics:
- Client Request Volume: The number of requests of the client per second.
- Client Success Rate(non-5xx responses): The success rate of requests of the client, all the non-5xx responses regard as succeed. 5xx response means the error from the server.
- Client Request Duration: The request delay of the client.
- TCP Received Bytes: The speed of bytes received of TCP.
- Server Request Volume: The number of requests of the server per second.
- Incoming Success Rate(non-5xx responses) By Source: The success rate of requests of the server, all the non-5xx responses regard as succeed. 5xx response means the error from the server.
- Server Request Duration: The request delay of the server.
- TCP Sent Bytes: The speed of bytes sent of TCP.
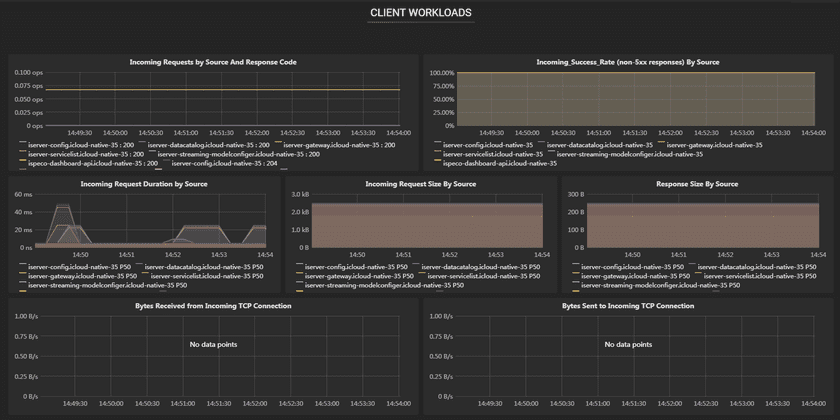
CLIENT WORKLOADS are workloads that are calling this service, have the following metrics:
- Incoming Requests by Source And Response Code: The service name and response code of incoming requests of the client.
- Incoming Success Rate(non-5xx responses) By Source: The success rate of incoming requests of the client.
- Incoming Request Duration by Source: The request delay of the client.
- Incoming Request Size By Source: The request siz of the client.
- Response Size By Source: The response size of the client.
- Bytes Received from Incoming TCP Connection: The speed of bytes received from incoming TCP connection.
- Bytes Sent to Incoming TCP Connection: The speed of bytes sent from incoming TCP connection.
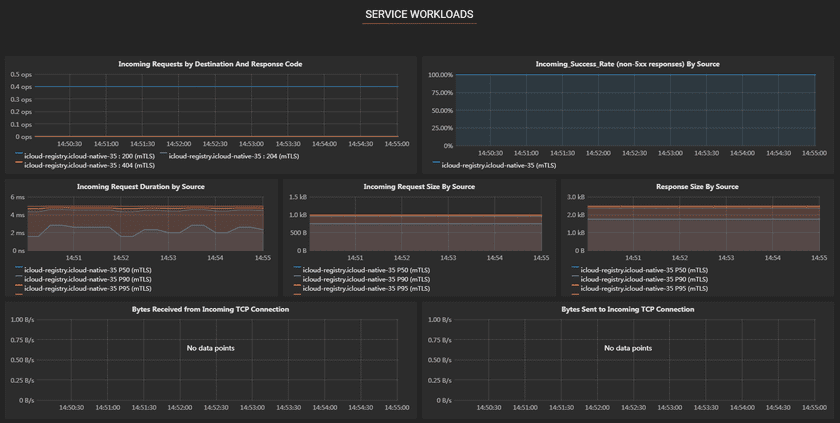
SERVICE WORKLOADS are workloads that are providing this service, have the following metrics:
- Incoming Requests by Destination And Response Code: The service name and response code of incoming requests of the server.
- Incoming Success Rate(non-5xx responses) By Source: The success rate of incoming requests of the server.
- Incoming Request Duration by Source: The request delay of the server.
- Incoming Request Size By Source: The request siz of the server.
- Response Size By Source: The response size of the server.
- Bytes Received from Incoming TCP Connection: The speed of bytes received from incoming TCP connection.
- Bytes Sent to Incoming TCP Connection: The speed of bytes sent from incoming TCP connection.
The monitoring panels could be enlarged or narrowed, and draged to other places of the page. What is more, users can save dashboard, control versions, select recording range, set refresh time, and manual refresh the panels, please refer to Service Resources Monitoring for the details.

