Tutorial
Statistical Report
SuperMap iManager supports to generate statistical report. The statistical report is an Excel file, there are 7 sheets in the report, they are Report Param, Site, CPU Useage Max Top, Memory Useage Max Top, Service Restart, Alert History, and User Operator. The report records all the events in the selected period, you can check the event details of applications and users, it is helpful for reviewing, summarizing, and reporting.
Generate Report
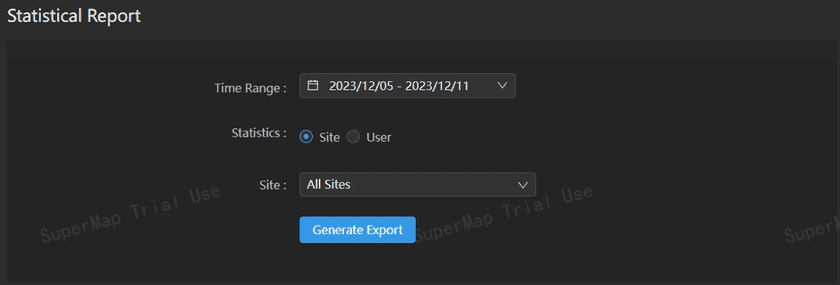
Please follow the steps below to generate statistical report:
- Logs in to SuperMap iManager.
-
Clicks Statistical Report on the left navigation bar.
- Selects Time Range of report. You can choose one day, last week, last month, last 3 months, etc; or customize the time range.
- Selects object. You can choose Application or User, Application is the application environment running in iManager, user is the user account created by iManager.
- Clicks on Generate Export, the statistical report will be downloaded to you local machine.
View Report
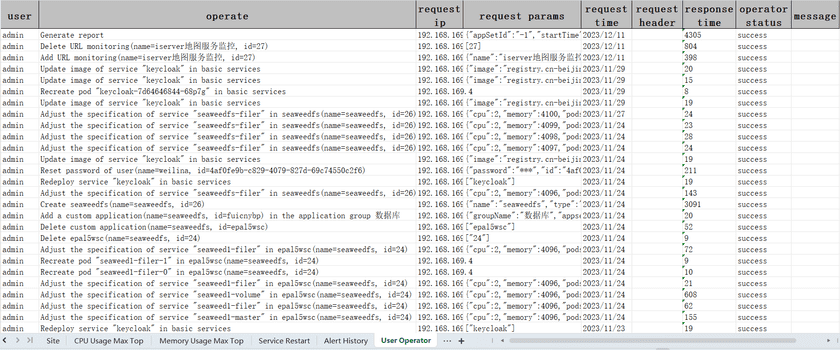
The generated statistical report is an Excel file, there are 7 sheets in the file, you can switch the sheets on the bottom side.
- Report Param: Recording the start time, end time, site ID, and user name of the report.
- Site: Recording the name, type, namespace, address, status, owver, and create time of the applications.
- CPU Useage Max Top: Recording name, site, namespace, and maximum cpu useage of pods.
- Memory Useage Max Top: Recording name, site, namespace, and maximum memory useage of pods.
- Service Restart: Recording name, site, namespace, and restart times of pods.
- Alert History: Recording alert rule, descriotion, and trigger time of alert events.
- User Operator: Recording user name, operate events, request ip, request params, request time, request header, response time, operator status, and message.

