Tutorial
iManager Node Managing and Environment Monitoring
SuperMap iManager supports the management and real-time environmental monitoring of Kubernetes nodes. iManager is running on Kubernetes, so a stable Kubernetes environment is the basic guarantee of the system. The overview page provides the monitoring indicators of CPU, Memory, Filesystem, and Network for Kubernetes node machines. Users can understand the health of iManager hardware environment, and find out the problem machine.
Kubernetes Node Management
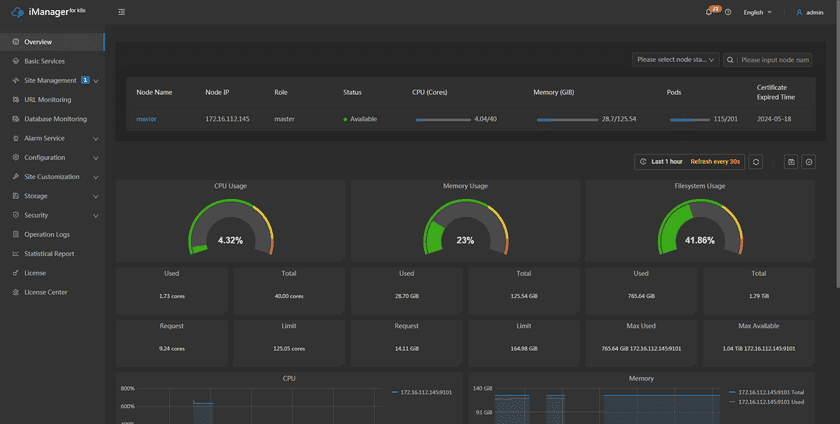
SuperMap iManager supports information display and management of Kubernetes nodes. Click Overview on the left navigation bar of iManager to enter the overview page, as shown in the following figure. The upper part of this page is a node list, displaying general information about all Kubernetes nodes associated with iManager, including node name, IP, role, status, memory, certificate expired time, and other information.
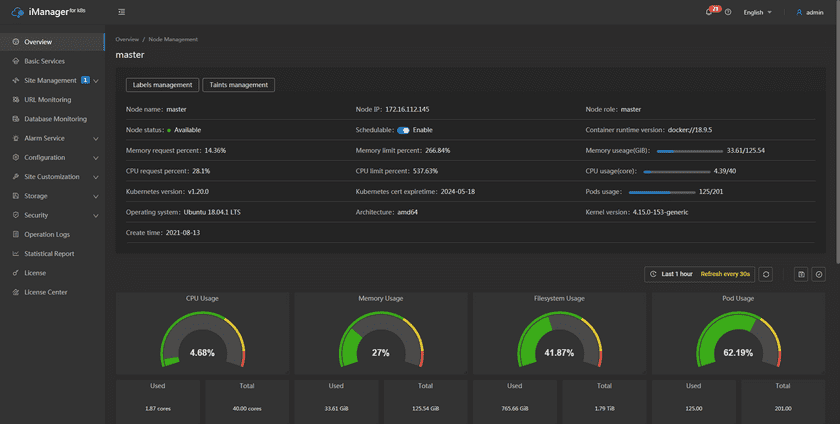
Click on any node name to enter the node details page, as shown in the following figure. This page allows you to view more information about the specified node, supports node scheduling, managing node labels and taints, and provides physical machine environment monitoring for individual nodes (please refer to the following for a detailed introduction to environment monitoring):
- View node details: In addition to the general information displayed in the node list, the node details page displays more detailed information about the memory, CPU, operating system, architecture, and other aspects of the machine where the node is located.
- Node scheduling: supports the management of node scheduling, which can turn on or off as needed.
- Labels Management: Click on the “Labels Management” button and in the “Labels Management” pop-up window, you can view the current labels and edit, add or delete them. For a detailed introduction, please refer to Kubernetes’ official document.
- Taints Management: Click the “Taints Management” button and in the “Taints Management” pop-up window, you can view the current stains, edit, add or delete them. For a detailed introduction, please refer to Kubernetes’ official document.
iManager Environment Monitoring
SuperMap iManager provides the real-time monitoring of physical machines environment, includes the machines to install Kubernetes master and worker nodes. The details of the monitoring content is introduced below:
Clicks Overview on the left navigation bar to enter the page. The page shows the loading of the machines by number and statistic charts(The number of machines is according to the actual requirement):
- The circle statistic charts show the useage of CPU, Memory, and Filesystem of iManager environemnt.
- The value under the circle statistic charts show the used/total amounts of the system resources.
- The CPU chart records the CPU useage of each machine.
- The Memory and Filesystem chart records the used/total amounts of the system resources of each machine.
- The Network chart records the receive/transmit speed between the machines.
Notes:
When viewing monitoring statistic charts, please make sure the time settings of local machine and Kubernetes node machines are same.
Clicks on the IP in the chart legend can switch the machine to view. The panels support to be dragged and adjusted.
In addition, in iManager’s Kubernetes node management and environmental monitoring, the following features are also available:
- Select recording range: Choose the time range of the monitor recording.
- Set refresh time: Set the refresh interval of the panels.
- Refresh: Click the button to refresh the panels.
- Save dashboard: After changing the panels’ size or draging the panels, click the button to save the current layout.
- Versions: All the layout styles are saved in the Versions, the Versions has the ability of restoring the layout to any style.
The above features are designed to assist and facilitate your management and environmental monitoring. Their specific uses are as follows:
- You can customize the layout of the iManager page according to personal or team preferences. Utilizing the save feature preserves the adjusted styles for future reuse as needed.
- After making multiple adjustments to the page, you can use version management to revert to any previous version of the page style, enhancing operational flexibility and fault tolerance.
- You can select specific time ranges in the monitoring data to gain a more detailed understanding of system performance and operation.
- Set automatic refresh intervals for the monitoring page according to your monitoring needs, ensuring real-time monitoring of the system status.
- Trigger a manual refresh of the page when immediate updates to monitoring data are required by clicking the manual refresh button.

